
Freight transportation accounts for 8% of global greenhouse gas emissions, with Scope 3 emissions from maritime freight representing 11% when you include warehouses and ports. Within the transport sector, freight represents 40% of total CO2 emissions. Maritime shipping dominates, 70% of all freight travels by sea, making it the most carbon-efficient option per ton-kilometer. Yet efficiency doesn't mean clean. Ships still burn fossil fuels, and with global trade volumes rising, emissions keep climbing.
Here's the reality: you can't eliminate freight. The global economy depends on billions of tons of cargo moving across oceans, roads, and rails every year. But you can control something far more immediate, which carriers transport your goods, and more critically, how their performance varies from voyage to voyage.
Most companies assume carrier choice is binary, pick Maersk or MSC, then move on. Wrong. The same carrier on the same route can produce vastly different emissions depending on operational factors: vessel utilization, port dwell time, speed optimization, weather conditions. These variables change with every voyage, yet most emissions calculations ignore them entirely.
Why Scope 3 Emissions Data Accuracy Matters
Operational decisions shape the carbon footprint of all transportation, whether over the road, in the air, or at sea. Shippers often feel their bargaining power might be limited when it comes to choosing how their cargo is transported to its destination. However, today, freight forwarders face increasing scrutiny from their clients about carrier choice. Why? Because a few wrong decisions can reverse all their sustainability progress.
At the same time, while such decisions require real-time intelligence, most available data sources rely on historical data. In such dynamic industries, depending on such data is a pitfall for any sustainability initiative.
The Historical Data Trap: Two Common Mistakes
Mistake #1: Using Outdated Averages
Shipper A: “I aim for compliance. This data suffices for reporting purposes.”
Indeed, for companies whose aim is to merely tick the emissions reporting box, outdated historical data is, and might remain, adequate.
However, you should keep in mind that data inaccuracy in emissions reporting can lead to both underestimation and overestimation of emissions. You might be paying up to 2.3 times more than you should, and that information will always remain hidden if you continue relying on historical data. This directly impacts the accuracy of your Scope 3 emissions reporting and your ability to meet reduction targets.
Example: Towards the end of 2023 and especially during 2024 and the larger part of 2025, vessel rerouting around the Cape of Good Hope led to a substantial increase in the average distance needed to complete a voyage from Asia to either Northern Europe or the Mediterranean. An increase in distance requires more fuel and, therefore, leads to higher emissions. Suppose you base your 2026 carbon footprint estimates on 2024 or 2025 data, as is the case with historical data like Clean Cargo. In 2026, vessels are returning to the Suez Canal, which in turn means shorter distances, less fuel, and fewer emissions. Are you prepared to pay the price for the lack of data intelligence?
Mistake #2: Relying on Carrier-Level Aggregates
Shipper B: “Data is historical, but I get detailed information about each carrier. I can use that to decarbonize.”
Looking at each carrier’s performance and how that changes depending on the trade examined is a critical step towards the right direction, yet still insufficient when aiming to decarbonize your supply chains.
First, this data remains historical. The fact that you examine how Maersk, MSC, or COSCO performed on the route from the Far East to the West Coast of North America in 2025 does not mean they will perform the same in 2026, nor that any observed differences will be minimal.
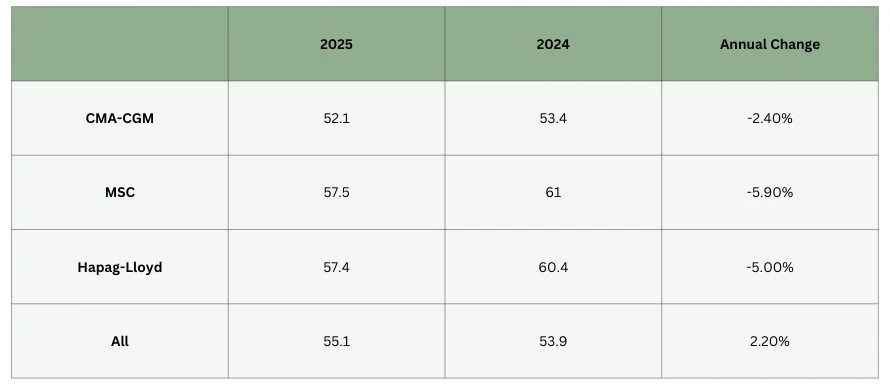
Example: If we focus on all containership voyages from China/East Asia to Northern Europe, we observe that the average well-to-wake emissions intensity was 53.9 g CO2e per TEU km in 2024, and 55.1 in 2025.
So, what is emissions intensity? It is a metric that quantifies the efficiency of a voyage. The lower the number, the better, since it expresses how many grams of CO2 equivalent are accounted for per TEU km. Therefore, it is a metric that assesses the effectiveness of the voyage by comparing its carbon footprint relative to its transport work.
Small changes in well-to-wake emissions intensity should not be taken lightly, as they may signal significant operational changes across different time periods. The efficiency of voyages in which CMA-CGM containers were transported improved by 5.9% over the two years, even as the intensity on the route generally deteriorated by 2.2%.
What changed between 2024 and 2025? For CMA-CGM, the most significant change was in the average number of TEU carried per voyage, which increased by 2.1%. Even though the average time spent in port increased by 8.8%, overall efficiency improved, as the carrier generated more transport work.
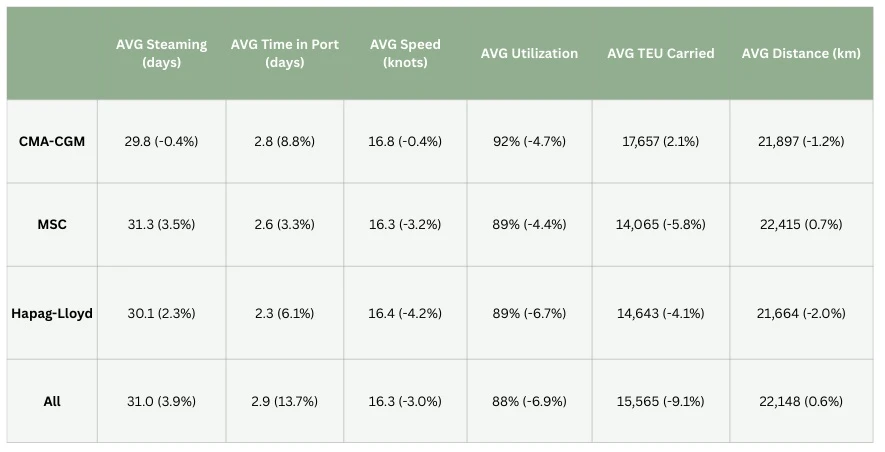
Although Hapag-Lloyd and MSC were slightly less efficient than CMA-CGM, all three carriers were more efficient than the route-average. In the case of CMA-CGM we already unraveled that the most major factor was the average TEU carried per voyage. However, both MSC and Hapag-Lloyd transported on average fewer TEU than all carriers on direct voyages between China/East Asia and Northern Europe. Therefore, in their case, the increased efficiency is due to lower port dwell time and shorter transit times.
While, in general, longer transit times are correlated with increased efficiency, when the distance traveled exceeds the minimum feasible distance, intensity increases and efficiency declines.
Reduce Scope 3 Emissions Through Voyage-Level Intelligence
Informed decisions require real-time intelligence. A voyage from point A to point B executed by the same vessel three times will yield different results every time.
Across different voyages:
- Different vessel utilization (more or fewer TEU to allocate emissions across)
- Different speeds (optimized speeds minimize fuel consumption and therefore emissions)
- Different weather conditions (air resistance, waves, and currents all affect the efficiency of a vessel during a voyage)
- Different number of port calls (more port calls translate to increased distance compared to the minimum feasible one, and therefore increased fuel consumption and emissions)
- Congestion in ports (when a vessel waits on anchorage or has berthed for operation, it does not produce any transport work but still burns fuel to keep its machinery running. Increased time in port hurts the voyage’s efficiency.
To optimize your supply chains, minimize your carbon footprint, cut costs, and decarbonize, real-time data is a necessity. In which vessel is your cargo loaded? What is its itinerary? What changes could you potentially implement to improve your transport’s efficiency?
These are questions you need to answer and reassess regularly if you truly aim to decarbonize your operations.
The Real-Time Data Solution
You can't optimize what you don't measure accurately. And you can't measure accurately with year-old averages.
Real-time carrier performance data solves this. Platforms like VesselBot's Supply Chain Sustainability Platform track emissions at the voyage level, not the carrier level. They integrate directly with your carrier ecosystem, automatically collecting operational data: vessel utilization, port dwell time, actual routes taken, fuel consumption patterns, speed variations. The kind of granular intelligence that shows you CMA-CGM improved efficiency by 5.9% while the route average deteriorated by 2.2%.
This isn't just about compliance reporting. When you know which specific voyages produce lower emissions, you can shift cargo allocation accordingly. When you see that Carrier A's Route 1 consistently underperforms while their Route 2 excels, you renegotiate contracts with leverage. When port congestion spikes emissions on certain itineraries, you adjust logistics planning. The result: more accurate Scope 3 reporting, lower carbon footprint, reduced transportation costs. Decarbonization and supply chain optimization aren't competing priorities. They're the same objective viewed through different lenses.
Companies serious about hitting their 2030 targets need voyage-level intelligence. Historical data tells you where you were. Real-time data shows you where to go next.