The landscape of container shipping route optimization is shifting again. Following months of vessels rerouting around the Cape of Good Hope due to Red Sea instability, major carriers are beginning their return to the Suez Canal. CMA CGM announced in December 2025 that its INDAMEX service will resume full Suez Canal transits, with the first vessel expected to complete the route by mid-January 2026. Other major carriers, including Maersk, are rumoured to be preparing similar moves. This return represents more than a tactical shift. It's a fundamental recalibration of route optimization strategies that will impact emissions, freight costs, port operations, and supply chain planning across global container shipping. Understanding the data behind these decisions is critical for logistics teams navigating this transition.
To understand what this return means, we need to examine what changed when vessels first rerouted and what the data reveals about the cost of that detour.
The transportation industry, especially shipping, is heavily impacted by both economic and geopolitical developments, as has been apparent over the past few years. On that note, shipping’s response to the geopolitical instability in the Middle East and the subsequent Houthi attacks on vessels was to reroute.
Close to the end of 2023, containerships -among other vessel types- started rerouting around the Cape of Good Hope. What started as an emergency response to extraordinary events led to a major restructuring of the containership market.
Suez Canal Crossings in 2025
During the first nine months of 2025, only three Very Large Container Ships (at least 17,000 TEU capacity) crossed the Suez Canal. Those levels represented an annual drop of 86% in the number of crossings and 84% in the number of unique vessels. At the same time, all crossings occurred in the first quarter of 2025, and the same company managed all three VLCS.
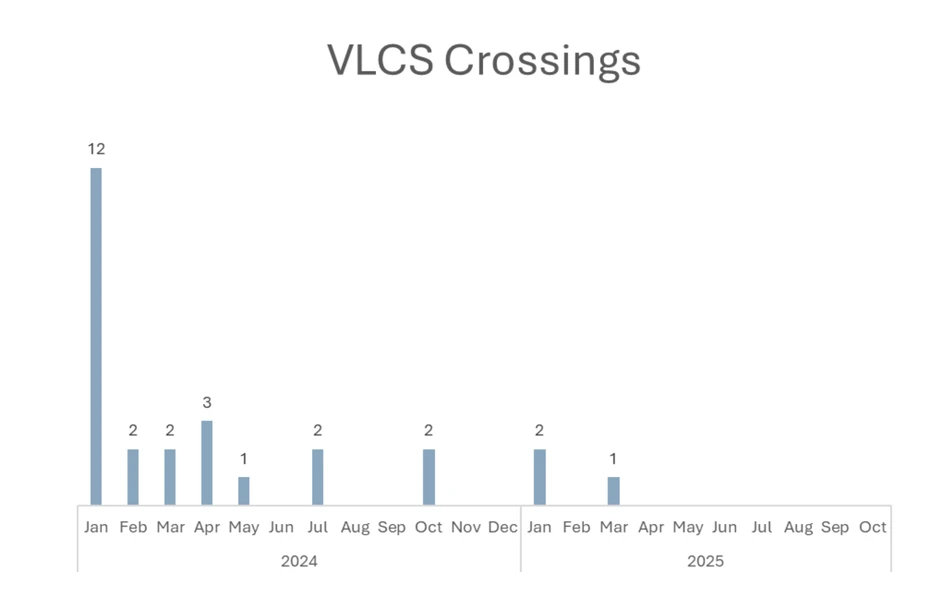
As for the 2024 crossings, from April onwards, all crossings were carried out by vessels managed by the same company. Therefore, between April 2024 and October 2025, only 11 crossings of Very Large Containerships occurred, all by the same carrier.
The abovementioned highlights the aversion of carriers to sail through the Red Sea, especially when it comes to larger vessels that:
- constitute considerably valuable assets, and
- can benefit to a greater extent from economies of scale
In the same manner, between the first quarter of 2024 (when the rerouting effect had not fully materialized) and 2025, Neopanamax (12,000-16,999 TEU) crossings dropped by 55.6%.
Route Optimization Impact: Voyage Duration, Emissions, and Congestion
The impact of rerouting is not merely a drop in the number of crossings through the Suez Canal. Route optimization decisions fundamentally changed as vessels charting a course around the Cape of Good Hope need to travel farther and, therefore, for longer, to reach their destination.
In turn, this affects the dynamics of supply and demand. If vessels need more time to conclude a voyage, they can perform fewer voyages in the same period. To counterbalance that, in theory, ships can travel more fully loaded, or carriers can change their schedules, so larger vessels are employed for routes affected by the rerouting. In practice, this is not always possible, since shippers have their own schedules to follow, and aggregating orders might not suit their clients. Moreover, carriers might not have the capacity required to both satisfy demand across different trades and counterbalance the rerouting effect. This highlights the inelasticity of supply when faced with demand growth and explains why the shipping industry tends to thrive in turbulent times.
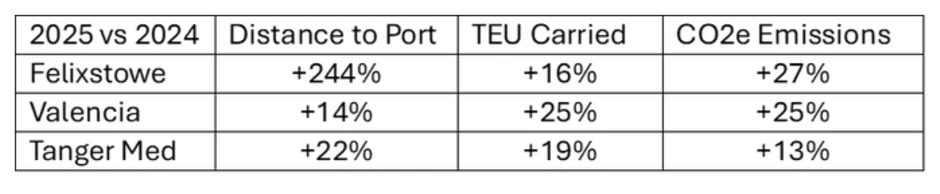
To more accurately capture the rerouting impact between 2024 and 2025, we will focus on first quarter voyages between China/East Asia and the Mediterranean/Northern Europe. From those voyages, we handpicked ports that saw large container traffic and highlighted what changed between the two years.
During the first quarter of 2025, the average distance traveled before reaching the port of Felixstowe in the UK increased by 244% year-over-year, even if voyages remained approximately the same. Also, on average, vessels headed for Felixstowe traveled for more time (21%) and carried more TEU (16%). A similar effect was also observed in the ports of Valencia and Tanger Med. The average distance traveled increased by 14.1% and 21.9% respectively, while the average TEU carried per voyage increased by 25.4% and 19.3% respectively.
At the same time, vessel rerouting and the subsequent carrier schedule changes created congestion in specific African, but mainly European, terminals, such as Antwerp and Rotterdam. Since containerships did not cross the Suez Canal, it did not make economic sense to continue calling Western Mediterranean ports with the larger vessels that typically sailed around Africa to reach Europe. Instead, this task was given to smaller containerships, after cargo destined for those ports was transshipped.
The average time containerships spent on anchorage in the port of Rotterdam during the first quarter of 2025 increased by 36.8% year-over-year. The respective increases in Hamburg and Antwerp were 8.3% and 50%. For all Q1 direct voyages between China/East Asia and Northern Europe, the average time spent in port increased by 32%.
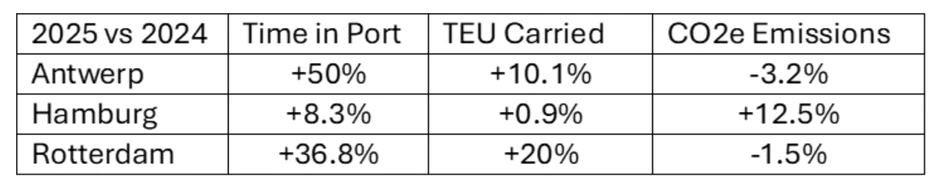
Moreover, as vessels traveled longer distances and spent more time in port, emissions increased. Total emissions in voyages destined for the port of Felixstowe increased 27% year-over-year during Q1 2025. The respective increases were 24.8% for the port of Valencia and 13.3% for Tanger Med, while Piraeus saw a 29.1% annual decrease. It is worth noting that despite rerouting, total emissions at the major container terminals in Rotterdam and Antwerp did not change between the first quarter of 2024 and the first quarter of 2025: year-over-year changes were -1% and -3%, respectively.
Return to Suez: Route Optimization Implications for Container Shipping
Following the ceasefire in the Gaza Strip, the Houthis signaled a stop to attacks against ships traversing the Red Sea, in what is perhaps the most positive development related to a possible return of ships to the Suez Canal. The Suez Canal Authority has already started talks with major carriers. CMA CGM is set to resume full transits in December, while Maersk is also rumored to be preparing a return.
Assuming most carriers were to return to the Suez Canal in the next few months, what would that mean for the shipping industry's route optimization strategies, and specifically containerships?
In the analysis below, we consider all containership crossings during the first nine months of each year to allow for meaningful comparisons between 2023, 2024, and 2025.
Vessel Characteristics
First, let’s take a look at what happened during 2023, which was minimally affected by vessel rerouting. Compared to 2023, 2025 crossings were:
- 34.5% more for Feeder containerships
- 52.5% fewer for Panamax containerships
- 86.3% fewer for Intermediate containerships
- 84.7% fewer for Post-Panamax containerships
- 92% fewer for NeoPanamax containerships
- 99.5% fewer for Very Large Container Ships
From all crossings in 2023, 11.4% were carried out by Feeder containerships. However, the respective percentages for 2024 and 2025 were 53.3% and 50.4%, respectively. On the other hand, an extreme drop is recorded in crossings of all other vessel sizes, especially the larger ones, namely NeoPanamaxes and VLCS.
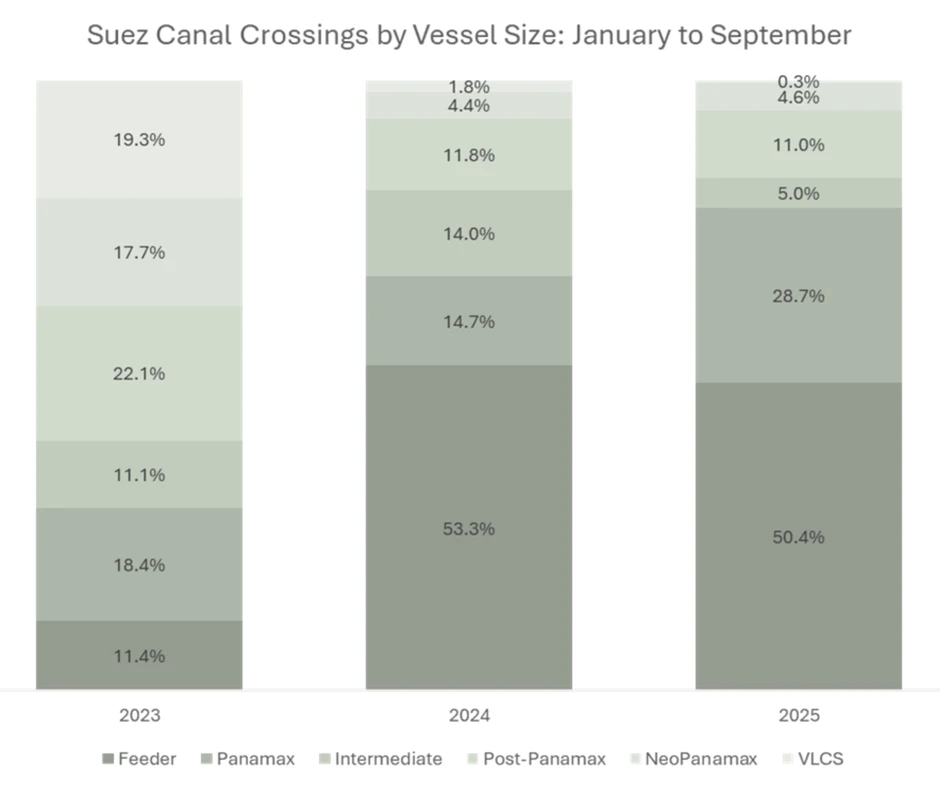
Those vessels benefit more from economies of scale, which means they could opt for the Cape of Good Hope route. Carriers also reorganized their schedules to divert younger, larger vessels away from the Red Sea.
This led Feeder vessels to search for opportunities in those waters. The increase in Feeder vessels trading in those waters contributed to the rise in the average age of ships crossing the Suez Canal. Feeder containerships, due to their smaller size, are more flexible and adaptable to changes in market dynamics. Therefore, their economic life is prolonged, which is one of the reasons the average vessel age for containership Suez Canal crossings increased.
Another reason for that increase was carriers using older vessels for crossings instead of younger ones. Younger vessels are modern and technologically advanced, making them more efficient and competitive, and therefore better candidates for vessel rerouting. At the same time, since older ships are of lower value, they are more open to assuming the risk the Red Sea trade entails.
Compared to 2023, 2025 crossings are:
- 86.6% fewer for vessels up to 5 years old
- 94.3% fewer for vessels between 6 and 10 years old
- 75.2% fewer for vessels between 11 and 15 years old
- 58.3% fewer for vessels between 16 and 20 years old
- 23.9% more for vessels older than 20 years old
Regarding the annual distribution by age group, while vessels over 20 years old accounted for just 8.5% of crossings in 2023, they accounted for 33.2% in 2024 and 34.3% in 2025.
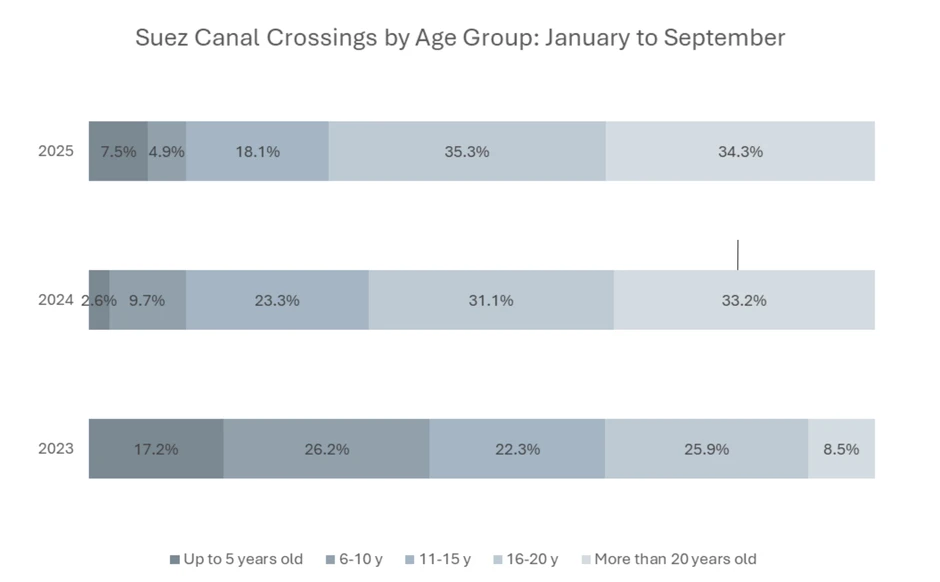
At the same time, in the first nine months of both 2024 and 2025, the percentage of crossings carried out by vessels aged 16-20 years increased, even as their numbers dropped by 58.3% between 2023 and 2025.
For all other age groups (vessels up to 15 years old), the percentage they hold in the distribution of crossings declined both in 2024 and 2025.
Based on everything mentioned above, if containership traffic in the Suez Canal steers towards normality, larger and younger vessels would be rescheduled to cross, reducing opportunities for smaller and older ships in these trades.
Voyage Characteristics
At the same time, in the routes primarily affected by vessel rerouting, namely from China/East Asia to Northern Europe and from China/East Asia to the Mediterranean, route optimization parameters and transport work demand would shift significantly.
Let’s suppose normality returned fast in the Red Sea and the Suez Canal. What should we expect in the first quarter of 2026?
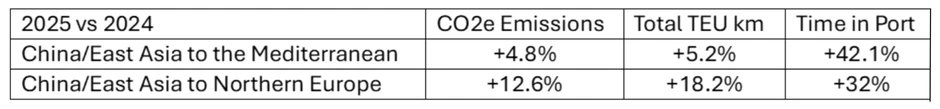
Between the first quarter of 2024 and the first quarter of 2025, total TEU km generated increased by 18.2% in the route from China/East Asia to Northern Europe and by 5.2% in the route from China/East Asia to the Mediterranean. This trend would most probably be reversed.
However, would that affect TEU-km demand in general? Yes, it would. Between Q1 2024 and Q1 2025, the total TEU-km generated increased by 8.6% even as the number of voyages dropped 2.9%. On average, vessels spent 6.1% more time steaming, carried 2.2% more TEU, and traveled 7.7% longer distances.
Therefore, if the industry returns to the Suez Canal, the balance of demand and supply would once again be disrupted. More vessels would be available to satisfy a continuously dwindling demand. As competition between carriers would increase, another drop in freight rates would occur, idle fleet capacity would also increase, and less competitive tonnage would ultimately be scrapped. Moreover, as the supply/demand balance worsens, carriers may choose to move to less dense schedules and lower utilization rates.
At the same time, Mediterranean ports could face increased congestion as carriers redraw their schedules. As previously analyzed, congestion is common in Mediterranean ports. However, this time, other ports, most probably the ones located deeper in the basin, would be the ones facing congestion, rather than terminals located close to the Gibraltar Straits.
Finally, from an environmental perspective, a return to the Red Sea would be positive. As distances decreased, fuel consumption and, therefore, emissions would be reduced. Moreover, as competition would increase and freight rates would drop, carriers would be incentivized to travel at optimized speeds, that moderate vessel consumption and cut costs.
As container shipping returns to the Suez Canal, the industry faces a complex route optimization challenge that requires more than historical data or industry averages. Carriers must weigh emissions against costs, evaluate port congestion impacts, and adjust schedules in real-time as the transition unfolds. The ability to quantify these tradeoffs with precision - using actual vessel performance data, real voyage conditions, and carrier-specific metrics - becomes the difference between strategic route decisions and reactive guesswork. For supply chain leaders tasked with reducing both emissions and logistics costs, the question isn't just whether ships return to Suez, but how to measure and optimize the impact of that return across their entire transportation network. Data-driven route optimization tools, like Supply Chain Sustainability platform, that track actual shipment/schedule-level emissions and costs provide the visibility needed to navigate this shift and turn regulatory pressure into operational advantage.