European ports are at a pivotal moment. The ESPO Environmental Report 2025 shows that 78% of ports now monitor carbon footprints, with 36% tracking emissions from terminals and tenants, and 37% accounting for ship emissions. Climate change ranks as the top environmental priority for the fourth consecutive year, while 80% of port authorities have established GHG reduction targets. Yet despite this progress in environmental governance, a fundamental operational challenge remains: the container shipping landscape is changing faster than traditional planning methods can accommodate.
Throughout 2025, major European container terminals have been grappling with mounting operational pressures that threaten both logistics efficiency and competitiveness. Rapid growth in container volumes, coupled with larger vessels, shifting alliance schedules, and rerouted trade flows, has stretched terminal capacity to its limits. In this environment, relying on historical shipping patterns or past years' data is no longer sufficient. What was valid for carrier schedules, terminal operations, or voyage duration six months ago is already outdated today. To remain competitive and resilient, shippers and logistics providers must base their planning on real-time intelligence, predictive analytics, and adaptive strategies rather than static historical benchmarks.
The following analysis demonstrates this point in practice. By examining how rapidly evolving conditions at three European gateways, Rotterdam, Antwerp, and Hamburg, have deviated from 2024 patterns, we show why historical benchmarks fail and why real-time, data-driven decision-making has become essential.
Rotterdam
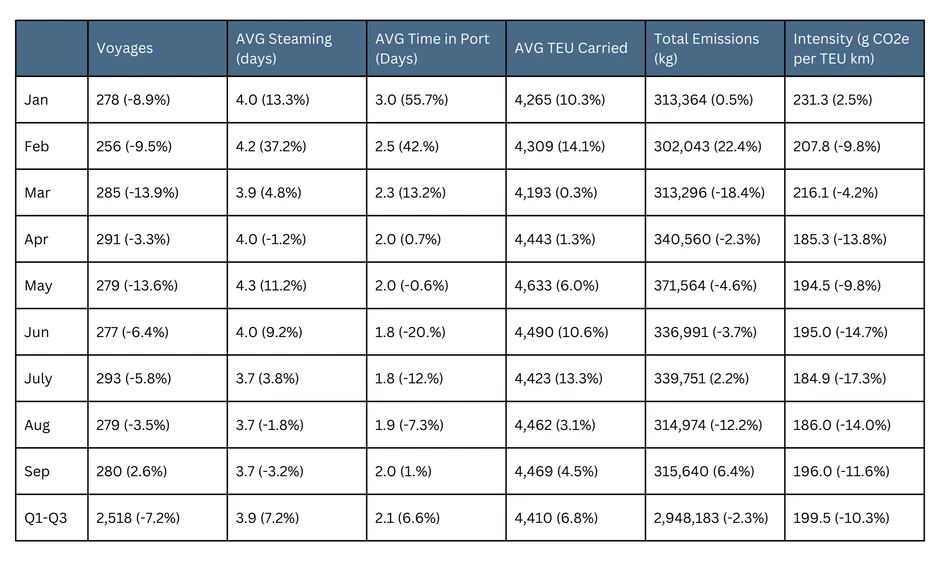
Throughout 2025, Rotterdam has been receiving fewer vessels and, as a result, less cargo. During the first nine months of the year, 2,518 containerships called at Rotterdam, a 7.2% drop compared to the same period in 2024, when the port recorded 2,718 containership port calls.
This is a persistent trend throughout 2025, with every month, apart from September, recording fewer port calls year-over-year. The largest annual drops were recorded in March (13.9%) and May (13.6%).
Voyage duration continuously changed throughout 2024 and continues to do so in 2025: the average time spent steaming increased significantly in the first quarter of 2025 compared to 2024. The most profound increase was recorded in February, equal to 37.2% year-over-year, as the average time spent steaming increased from 3 days to 4.2 days. Another significant increase occurred in May (11.2% year-over-year), from 3.8 days to 4.3 days. Those changes mainly reflect the impact of vessel rerouting around the Cape of Good Hope.
At the same time, the first nine months of 2025, the average time spent in port increased by 6.6% year-over-year. Most significant changes occurred in January (55.7% - from 1.9 days to 3 days) and February (42% - from 1.8 days to 2.5 days). Again, due to vessel rerouting, carriers skipped port calls in the Mediterranean and redirected vessels to European terminals. In turn, this resulted in increased vessel queues and congestion, effectively prolonging the average time each vessel spent in port. June, July, and August saw drops in the average time spent in port, hinting at normalization of the schedules centered around Northern Europe.
Skipping ports and shipment aggregation led to an overall increase of 6.8% in the average TEU carried between the first nine months of 2024 and the first nine months of 2025. While this improved vessel utilization, the unpredictability of these route changes creates significant logistics efficiency challenges for shippers unable to anticipate which ports will be skipped or consolidated. Largest year-over-year increases were recorded at the start of the year, but also in June and July.
While emissions increased year over year, the intensity of voyages to Rotterdam decreased. This highlights the importance of vessel size and utilization. The larger and more loaded a vessel is, the lower its well-to-wake emissions intensity, since emissions are allocated to more containers. Intensity dropped by 10.3% year-over-year between the two periods, from an average of 222.5 g CO2e per TEU km to 199.5 g CO2e per TEU km.
Hamburg
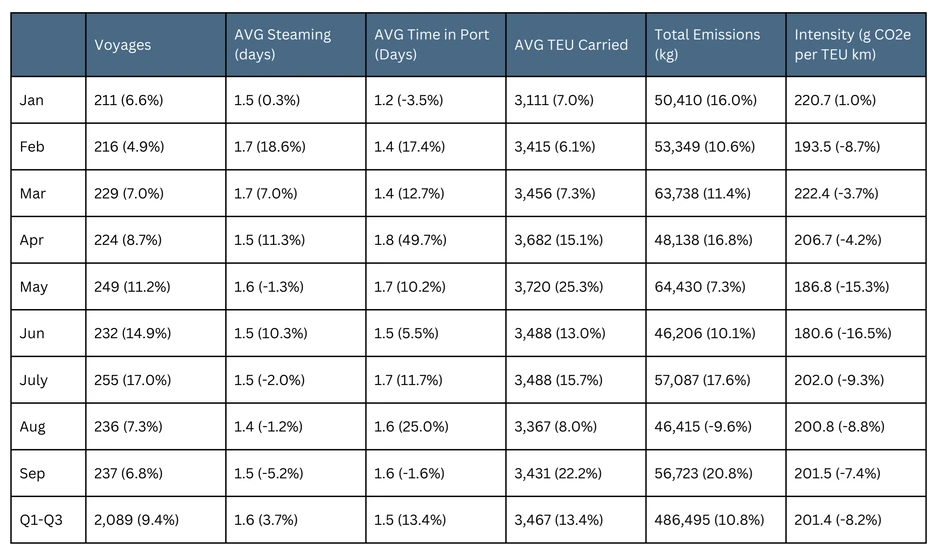
Unlike the port of Rotterdam, the port of Hamburg experienced a significant increase in activity compared to 2024. The number of port calls leaped by 9.4% in the first nine months of 2025, compared to the same period in 2024, from 1,910 to 2,089.
The largest year-over-year increases occurred in the second and third quarters, with June, July, and September recording 18.7%, 15.9%, and 15.5% increases in port calls, respectively.
The average steaming time increased modestly by 3.7% between the two years, from 1.5 days to 1.6 days. Increases were more pronounced in February, April, and June, reaching 18.6%, 11.3%, and 10.3%, respectively. Moreover, the average time spent in port increased by 13.4% annually during the first nine months of 2025. April saw an increase of 49.7%, from 1.2 days to 1.8 days, while August saw a 25% increase, from 1.3 days to 1.6 days.
It’s worth noting that in May, June, August, and September, the average time spent in port was higher than the average time spent steaming to reach the port. This unusual pattern, where port time exceeds voyage time, represents a fundamental shift that impacts logistics efficiency planning. Overall, the average time spent steaming and the average time spent in port were both 1.55 days in the first nine months of 2025.
At the same time, vessel utilization recorded a slight increase of 2.5% between the two periods, while the average number of TEU carried per voyage significantly increased by 13.4%, from 3,058 TEU in 2024 to 3,467 TEU in 2025. Yearly increases ranged from 6.1% to 25.3% in 2025 so far, with May seeing the most significant 25.3% increase, from 2,967 TEU in 2024 to 3,720 TEU in 2025.
While total emissions increased by 10.8% in 2025, the well-to-wake emissions intensity decreased by 8.2%, from 219.5 g CO2e per TEU km to 201.4 g CO2e per TEU km.
Antwerp
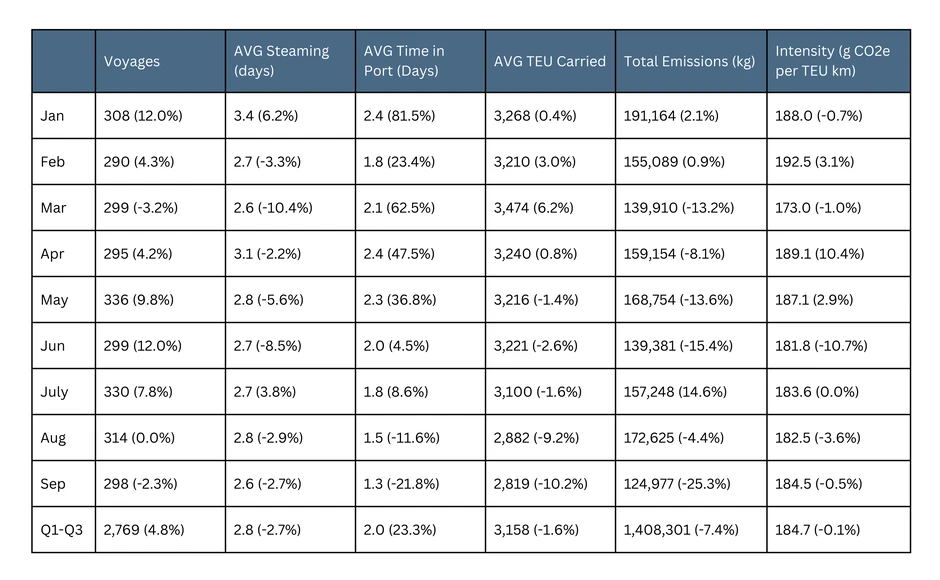
Antwerp experienced significant volatility throughout 2025, particularly in average time spent in port, as vessel queues and congestion skyrocketed in the first quarter of the year.
In general, the first nine months of 2025 saw a 4.8% annual increase in voyages and a 2.7% drop in the average time spent steaming. However, the average time spent in port increased by 23.3%: in January, the year-over-year increase was 81.5%, from 1.3 days to 2.4 days. In February, March, April, and May, the increases were 23.4%, 62.5%, 47.5%, and 36.8%, respectively. In contrast, during the third quarter, the average time spent in the port of Antwerp dropped by 11.6% in August and by 21.8% in September.
While the utilization rate of vessels arriving at Antwerp slightly increased in the first nine months of 2025 (2.5% increase), the average TEU carried dropped by 1.6%. During the first quarter, monthly increases were observed: 3% in February and 6.2% in March. However, drops of 9% in August and 10.2% in September were observed.
At the same time, while total emissions decreased by 7.4% year-over-year in the first nine months of 2025, the well-to-wake intensity of voyages remained practically the same at 184.7 g CO2e per TEU km.
From Historical Averages to Real-Time Logistics Efficiency
The data from Rotterdam, Hamburg, and Antwerp tells a clear story: historical averages no longer provide reliable planning foundations. Voyage times that increased 37.2% year-over-year in Rotterdam, port congestion that spiked 81.5% in Antwerp's January, and emissions intensity shifts across all three terminals, these aren't statistical anomalies. They're the new baseline volatility. Consider the practical implications. For instance, if you had relied on 2024 averages to plan your 2025 operations, the developments outlined above illustrate how significantly voyage times and emissions intensity could have been misestimated. That doesn't just affect emissions reporting. It fundamentally undermines supply chain planning, from inventory management to customer commitments.
But relying on 2024 data isn't the only risk. Using data from January to plan for December is equally problematic. What companies need is supply chain visibility that accurately depicts current conditions, not conditions from six or twelve months ago. This is where the gap between environmental ambition and operational reality becomes clear. Ports can set ambitious GHG reduction targets, as 80% now have. They can monitor carbon footprints comprehensively, as 78% do. But achieving these targets requires accurate, real-time measurement of actual vessel movements, actual port times, and actual emissions, not estimates based on outdated patterns.
The solution isn't abandoning historical data, as they could be valuable for identifying long-term trends. It's augmenting it with real-time primary data that captures today's operational realities. By tracking actual vessel movements, monitoring port-specific congestion patterns, and calculating emissions based on current conditions rather than aggregated data, companies can make decisions that reflect the market as it is, not as it was.
This shift from historical benchmarks to real-time intelligence isn't just about operational efficiency. It's about building supply chains that are simultaneously more sustainable and more resilient, capable of adapting to the volatility that has become the defining characteristic of modern container shipping. Vesselbot's Logistics Intelligence platform addresses this need by tracking actual vessel movements, monitoring port-specific congestion patterns, and calculating emissions based on current operational conditions rather than historical averages.