The majority of transpacific cargo moves neither on the smallest nor the largest containerships. Post-Panamax containerships (with capacity for 8,000-11,999 twenty-foot equivalent units) and NeoPanamax containerships (12,000-16,999 TEU) handle nearly 60% of container traffic between Asia and North America's West Coast, yet most shippers have zero visibility into which vessels carry their goods, let alone how those vessels operate.
Here's the problem: Your freight forwarder makes operational decisions, carrier selection, speed choices, and routing calls that dramatically impact your supply chain emissions. And you're left reporting emissions without understanding what's actually happening to your cargo.
This isn't a theoretical concern. VesselBot analysis of the first 9 months of 2024 and 2025 containership voyages on the China/East Asia to North America West Coast route, reveals that operational decisions create supply chain emissions variations of over 50%. The difference between optimized and non-optimized operations isn't marginal. It's the gap between meeting your sustainability targets and missing them entirely.
The Visibility Gap in Supply Chain Emissions
Most companies rely on freight forwarders for logistics management. This creates a fundamental challenge: the people making operational decisions that affect your carbon footprint aren't the same people responsible for your sustainability reporting.
Freight forwarders choose carriers, negotiate speeds with ship operators, and determine routing, all optimizing for cost and delivery time as requested by the shipper. Meanwhile, sustainability teams report aggregate supply chain emissions using industry averages or carrier-provided data that may bear little resemblance to actual operational performance.
The question isn't whether freight forwarders are doing their job. They are. The question is whether you have the visibility to understand how their operational choices impact your environmental performance.
What’s Actually Happening at Sea
VesselBot analyzed containership voyages between Asia and North America during the first 9 months of 2024 and 2025. Post-Panamax vessels and NeoPanamax vessels dominate this trade lane, handling cargo for virtually every major shipper with transpacific supply chains.
The analysis revealed something most shippers never see: significant speed variations that directly correlate with emissions intensity. The following graphs illustrate the changes in vessel speed during the first nine months of 2024 and 2025 for voyages between China/East Asia and the West Coast of North America.
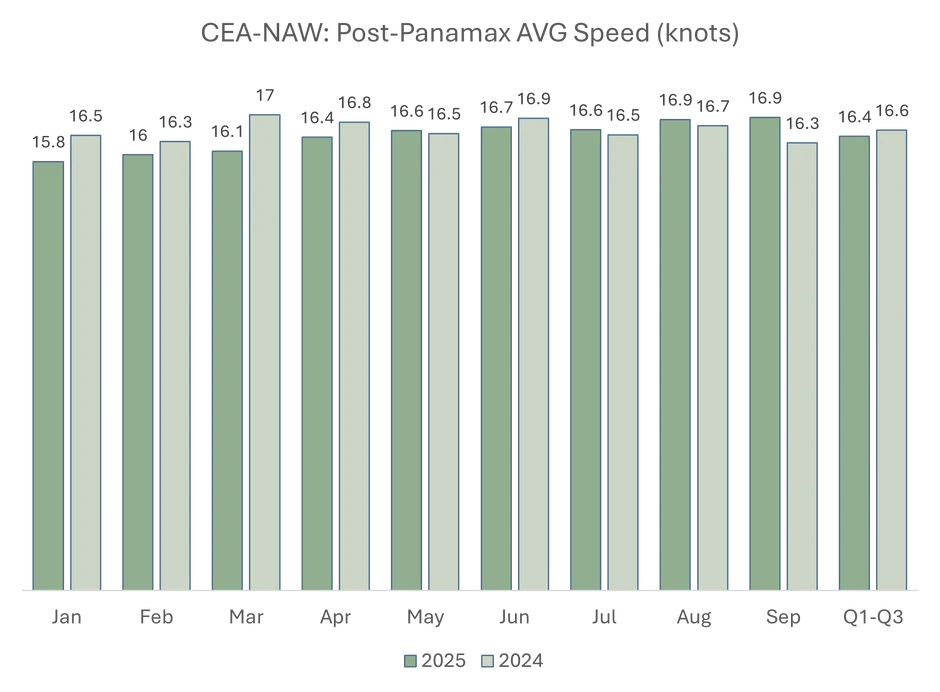
Figure 1 Average Speed of Post-Panamax vessels in the China/East Asia to the West Coast of North America route. Period: January to September 2024 and 2025
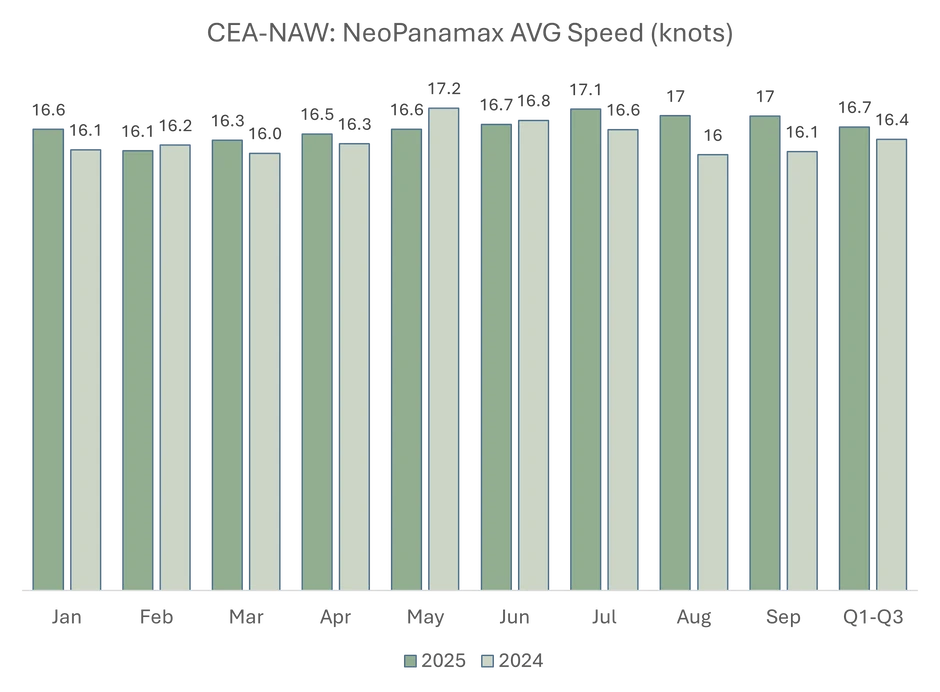
Figure 2 Average Speed of NeoPanamax vessels in the China/East Asia to the West Coast of North America route. Period: January to September 2024 and 2025
For most months, year-over-year differences do not seem significant. However, in March 2025, Post-Panamax vessels cruised at 5.4% lower speeds year-over-year. Moreover, in August and September 2025, NeoPanamax vessels cruised at 6.2% higher and 5.6% higher speeds year-over-year, respectively.
This is important to note, since most approaches to supply chain emissions reporting rely on data derived from voyages that occurred one year prior. Even more importantly, those differences would not be taken into account, even if 2025 data were used to report 2025 emissions. Why? Most would use the average of the year, meaning that any differences would be significantly evened out.
Average speed for the total nine-month period is 16.4 knots for Post-Panamax containerships and 16.7 knots for NeoPanamax containerships. Those levels are only 0.9% and 1.9% different than the ones recorded in 2024. Practically, as the period used to extract averages widens, year-over-year differences become less significant.
Those differences are important to note and analyze, since they are not random variations. Instead, they reflect operational decisions by carriers responding to market conditions, schedule pressures, and cost optimization strategies.
Speed as the Critical Variable
To understand how speed affects emissions, we divided voyages into four quartiles based on operational speed:
- Quantile 1: The voyages with the 25% lowest speeds
- Quantile 2: The voyages with the next 25% of speeds (25-50%)
- Quantile 3: The voyages with the next 25% of speeds (50-75%)
- Quantile 4: The voyages with the 25% highest speeds
This quantile-based approach enabled precise analysis of how operational speed decisions impact emissions performance across vessel categories. Vessel utilization remained relatively high across all quartiles, ranging between 82-91% for both vessel types in 2025, ensuring that speed was an important variable affecting emissions intensity. Given the importance of utilization in well-to-wake emissions intensity, consistently high utilization will allow us to infer more decisively about the role of other factors, such as the vessel speed, in shaping intensity.
The analysis focused on Well-to-Wake (WTW) emissions intensity measurements across these speed quartiles for both vessel types, providing clear insights into the relationship between operational decisions and environmental performance.
The 59% Emissions Gap
For 562 Post-Panamax voyages between China/East Asia and the West Coast of North America, the average speed was found to be 16.4 knots during the first nine months of 2025. For those voyages, average well-to-wake emission intensity was found to be 57.9 g CO2e per TEU km, with each vessel carrying an average of 8,066 TEU for approximately 11,600 km, emitting an average of 5,107 tons of CO2e.
Dividing those voyages based on their speeds, we observe that the most efficient voyages are those belonging to the lowest 25% quantile: average well-to-wake intensity was 44.6 g CO2e per TEU km (23% lower than the average derived from all 562 Post-Panamax voyages). In these 131 optimized voyages, the average speed reached 14.2 knots (14% lower than the general average), while utilization was the same, and the average TEU carried per voyage increased slightly by 2.5%.
At the same time, we notice that as average speed increases, steaming duration decreases. In the lowest quantile, it is equal to 18.2 days, but it decreases to 14.7 days for the 125 voyages belonging to the 25% highest speed quantile.
In the 25% highest speeds quantile, average intensity reached 71 g CO2e per TEU km. Those levels are 23% higher than the average of Post-Panamax containerships in the specific route, but also 59% higher than the average of the voyages belonging to the lowest 25% quantile.
- Optimized speed voyages (lowest 25%): 44.6 g CO2e per TEU-km
- Highest speed voyages (top 25%): 71 g CO2e per TEU-km
- Performance gap: 59% higher emissions intensity at highest speeds
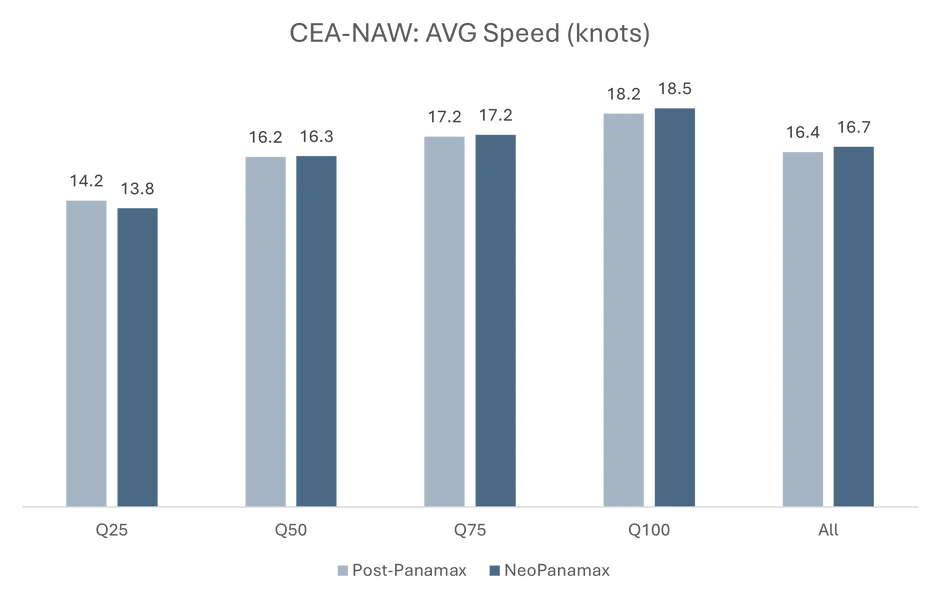
Figure 3 Average speed (knots) in the China/East Asia to the West Coast of North America route, grouped by speed quantiles. Period: January-September 2025
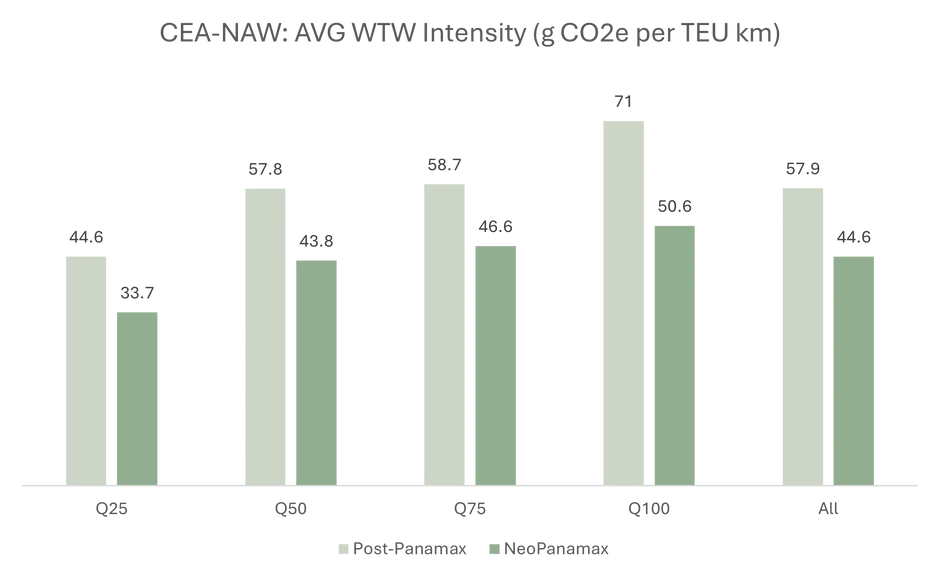
Figure 4 Average well-to-wake emissions intensity (g CO2e per TEU km) in the China/East Asia to the West Coast of North America route, grouped by speed quantiles. Period: January-September 2025
Moving on to NeoPanamax containership voyages, 306 took place during the first nine months of 2025. In these, the average speed was 16.7 knots, while the average well-to-wake intensity was 44.6 g CO2e per TEU km.
For the 53 voyages belonging to the lowest 25% speed quantile, intensity was on average just 33.7 g CO2e per TEU km, which is 24% lower than the average of all 306 voyages. Again, across the different quantiles, we observe an inverse relationship between speed and steaming duration: vessels that travel faster will arrive sooner at their destination.
Moreover, ships arriving sooner at their destination spent, on average, less time in port (time spent in port for the lowest 25% quantile was 4.7 days, while time spent in port for the highest 25% quantile was just 3 days).
The average intensity of voyages belonging to the highest 25% quantile was 50.6 g CO2e per TEU km, which is 13% higher than the average for all 306 NeoPanamax voyages on the specific trade, but also 50% higher than the intensity recorded in the voyages belonging to the lowest 25% quantile.
- Optimized speed voyages (lowest 25%): 33.7 g CO2e per TEU-km
- Highest speed voyages (top 25%): 50.6 g CO2e per TEU-km
- Performance gap: 50% higher emissions intensity at highest speeds
This isn't about perfect versus poor operations. The lowest speed quartile represents the most efficient operational approach, what the data identifies as optimized speed voyages. These aren't theoretical ideals. They're real operations happening across 25% of voyages. The highest speed quartile represents vessels operating at speeds common enough that another 25% of all voyages fall into this category.
NeoPanamax vessels consistently achieve lower emissions intensity than Post-Panamax vessels across all speed quartiles and both time periods. This makes sense. Larger vessels benefit from greater economies of scale, distributing emissions across more TEUs.
But vessel type alone doesn't determine emissions performance. A NeoPanamax vessel operating at high speed produces higher emissions per TEU-km than a Post-Panamax vessel operating at optimized speed.
Therefore, in some cases, the operational decision matters more than the hardware spec.
Why Industry Averages Fail
Most supply chain emissions reporting relies on default values provided by carriers or calculated using industry average methodologies. These approaches have a fundamental flaw: they cannot account for operational variability.
Consider what happens when you report using carrier-provided default emissions factors:
- Carrier provides average well-to-wake emissions intensity for their fleet
- Your cargo might have travelled on vessels in the lowest speed quartile
- Your report is based on the fleet average
- Your actual emissions might be at least 30% lower
This isn't a rounding error. It's a systematic misrepresentation of your carbon footprint.
The same logic applies to industry standard methodologies that use default speeds and vessel characteristics. They produce defensible numbers for regulatory compliance. They don't produce accurate numbers for understanding actual supply chain emissions or identifying reduction opportunities.
Strategic Implications for Supply Chain Leaders
1. Transparency Enables Strategy
Even when working through freight forwarders, companies can transform their sustainability approach by demanding shipment-level emissions data based on actual operational conditions. This requires:
- Emissions calculations using actual vessel speeds, not defaults
- Vessel-specific performance data, not fleet averages
- Route-specific measurements, not trade lane estimates
- Temporal accuracy reflecting when voyages occurred
With this visibility, sustainability teams can identify patterns invisible in aggregate reporting. Which trade lanes consistently show high emissions? Which carriers operate most efficiently on specific routes? Where do speed choices create the largest emissions penalties?
2. Informed Partnership Decisions
Understanding how operational factors affect supply chain emissions enables more strategic conversations with logistics providers.
Instead of: "We need lower emissions”, you can say: "Our analysis shows 40% of our Asia-to-US cargo travels on vessels operating in the highest speed quartile, producing 45% higher emissions than optimized operations. We need to understand the service versus emissions tradeoff and evaluate alternative routings or transit time expectations."
This specificity transforms sustainability from a compliance checkbox into a strategic logistics discussion.
3. Moving Beyond Reporting to Optimization
Granular, shipment-level emissions data reveals optimization opportunities that aggregate reporting conceals:
- Modal shifts: Identifying specific trade lanes where slower ocean transit combined with optimized inland transport reduces total supply chain emissions and cost
- Carrier performance: Evaluating carrier operational efficiency on specific routes, not just fleet-wide commitments
- Schedule flexibility: Understanding where transit time flexibility enables lower-emission routings
- Volume consolidation: Finding opportunities to improve vessel utilization on specific routes, directly reducing emissions intensity
These optimizations require precision. You can't optimize what you can't measure accurately.
The Data Infrastructure Question
The analysis presented here required:
- Vessel position data tracking actual speeds throughout voyages
- Vessel technical specifications (engine types, capacity, age)
- Route-specific conditions (weather, currents, port congestion)
- Well-to-Wake emissions factors accounting for fuel types and supply chains
- Temporal correlation between cargo shipments and vessel operations
Most companies lack access to this data infrastructure. Their freight forwarders have some of it. Their carriers have more. But neither typically provides shipment-level granularity correlated with actual operational conditions.
Building internal capability to process vessel tracking data, correlate it with shipment records, and calculate accurate emissions is possible. But it requires significant investment in technology and logistics expertise.
The alternative is partnering with specialized platforms that have already built this infrastructure. This isn't about outsourcing responsibility. It's about accessing the technical capabilities necessary to measure accurately, report credibly, and optimize effectively.
From Hidden Impact to Competitive Advantage
The 59% emissions gap between optimized and high-speed operations isn't a vessel technology problem. It's an operational visibility problem.
Shippers who gain access to shipment-level emissions data correlated with actual vessel operations can:
- Report accurately, avoiding both over-reporting (wasting money on unnecessary carbon credits) and under-reporting (risking greenwashing allegations)
- Identify specific optimization opportunities invisible in aggregate data
- Have informed discussions with logistics providers about the service-emissions tradeoff
- Set meaningful reduction targets based on operational reality, not industry averages
- Track progress toward those targets with precision
Companies that continue relying on default emissions factors and industry averages will meet compliance requirements. But they'll miss reduction opportunities worth millions in carbon costs and operational efficiency.
Global supply chains are entering an era where emissions visibility isn't optional. CSRD reporting requirements, CDP disclosure standards, and corporate sustainability commitments all demand accurate supply chain emissions data. More importantly, the economic incentives are aligning. EU ETS costs for maritime emissions, carbon border adjustments, and customer sustainability requirements make emissions optimization financially material.
The question facing supply chain leaders isn't whether to measure transportation GHG emissions accurately. It's whether to start now, when optimization opportunities are largest, or wait until regulatory pressure and carbon costs force action.
The data shows what's real: operational decisions create emissions variations of over 51% between the most and least efficient approaches. The technology to measure and monitor these operations exists. The optimization opportunities vary by shipper, trade lane, and operational context, but they're real.
What's missing isn't the capability. It's the decision to demand visibility into what's actually happening to your cargo and use that visibility to drive strategic decisions.