With the first wave of Corporate Sustainability Reporting Directive (CSRD) reporting now complete, one thing is clear: meeting compliance requirements and achieving credible, actionable reporting are not the same thing. KPMG's analysis of first-round reporting highlighted recurring issues: unclear data sources, weak validation processes, and inconsistent disclosure quality, all of which increased assurance costs and, in some cases, led to restatements. These findings confirm a growing reality: you can comply with poor quality data, but it will cost you far more in the long run. Low quality data may pass a compliance test, but it drives up audit complexity and with it audit costs, introduces restatement and reputational risk, and prevents organizations from identifying meaningful efficiency or emissions reduction opportunities. What looks like a cost saving today becomes a multiplier of future costs: financial, operational, and reputational.
Take Scope 3 transportation emissions. Most shippers depend on carrier-provided data built on industry averages, standard emission factors, or modeled estimates. These figures meet minimum disclosure requirements. But they also replicate the exact weaknesses KPMG identified: vague definitions, inconsistent sources, and limited ability to validate results. When emissions are based on route averages, you cannot tell whether they accurately reflect your own shipment performance, creating the risk of overstatement, and you lose the ability to drive reductions or identify efficiency opportunities through data.
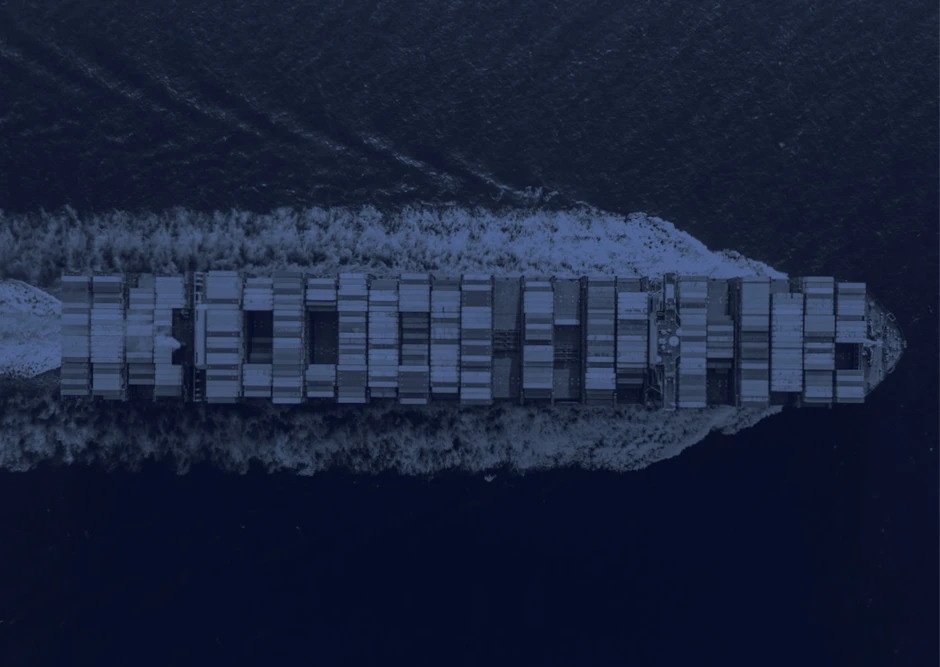
To illustrate why even lane-level averages fall short and what granular data can truly reveal, we analyzed 538 voyages between China and East Asia and North America's West Coast during Q3 2025, focusing on two factors that most strongly influence both emissions and supply chain performance: vessel size and carrier selection patterns.
Supply Chain Efficiency: Why Vessel Size and Routing Matter
Regulations aimed at promoting sustainable practices are often seen as a challenge by organizations, which are already busy trying to improve supply chain efficiency. However, emissions reporting is not just a challenge but also an opportunity, because sustainable operations depend on efficient supply chains.
Among various transport modes, shipping is the most efficient both environmentally and economically. Ships carry more cargo than commercial aircraft, trains, or trucks, while covering longer distances. As a result, the transport workload increases, and emissions are spread across a larger volume of cargo.
To broadly define environmental efficiency, we use the metric of emissions intensity. Emissions intensity expresses the amount of CO2e emissions allocated to each unit, transported in a voyage, for each ton (TEU) km (mile) generated during the voyage.
Intensity is affected by many different factors, but the most significant ones are as follows:
- Utilization and cargo carried: Larger vessels whose capacity is better utilized during a voyage record lower emissions intensity.
- Voyage duration: Voyages when vessels steam longer and spend less time in port tend to be more efficient.
- Distance: The closer a voyage’s distance is to the minimum feasible distance required to complete it, the more efficient it becomes.
- Speed: Vessels are designed with an optimal speed range. Vessels that deviate from that range during voyages record higher emissions intensity.
Based on the above, emissions intensity might differ substantially between different routes. In the most recent Decoding Maritime Emissions report, we analyzed 73,353 containership voyages carried out by 4,750 ships tracked by VesselBot during the third quarter of 2025.
Across all routes, average well-to-wake (WTW) emissions intensity was 195.9. On average, each ship steamed 3.5 days and spent 1.6 days in port. Ships utilized approximately 68% of their total capacity, carrying an average of 2,663 TEU over 2,136 km, emitting 686 tons of CO2e.
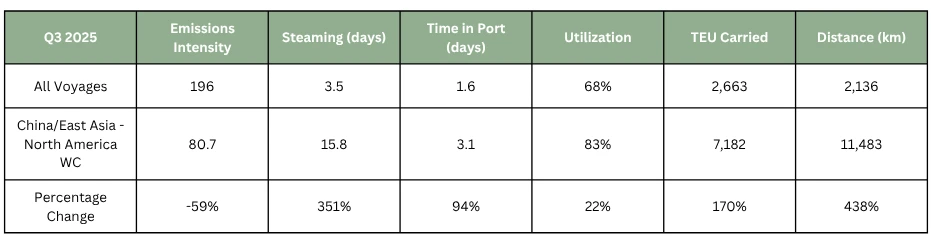
Table 1 Voyage characteristics on the China/East Asia to North America West Coast route compared to all voyages, Q3 2025.
In contrast, if we focus only on voyages between ports located in China and East Asia, and those located on the West Coast of North America - a major fronthaul route for the container shipping market - voyage characteristics differ considerably. Just 538 voyages were completed on that route during Q3 2025, carried out by 396 vessels that steamed on average for 15.8 days and spent 3.1 days in port. They utilized 83% of their capacity and transported an average of 7,182 TEU over 11,483 km, emitting 5,031 tons of CO2e per voyage.
The above difference in characteristics, despite 634% more average emissions compared to all voyages, resulted in a 59% reduction in well-to-wake emissions intensity. The intensity was 80.7 g CO2e per TEU km on the China/East Asia – North America West Coast route.
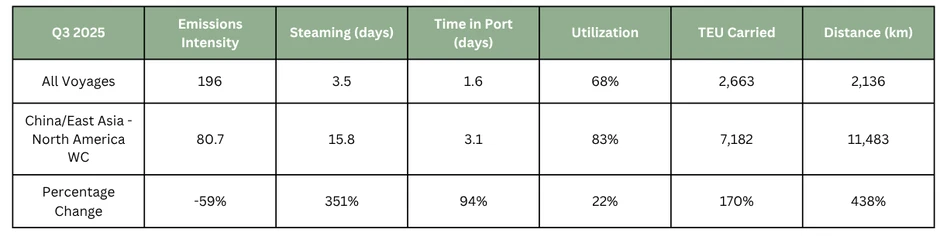
Table 2 Voyage characteristics on the China/East Asia to North America West Coast route compared to all voyages, Q3 2025.
The above illustrates how industry averages can hurt a company's sustainability planning and budgeting.. While most organizations avoid broad, average-based in favor of trade-specific ones, these figures still fall short when it comes to driving true supply chain efficiency and informed decision-making.
Even among the 538 voyages that occurred on the China/East Asia to North America West Coast route during the third quarter, significant differences emerge when factors other than the route itself are taken into account.
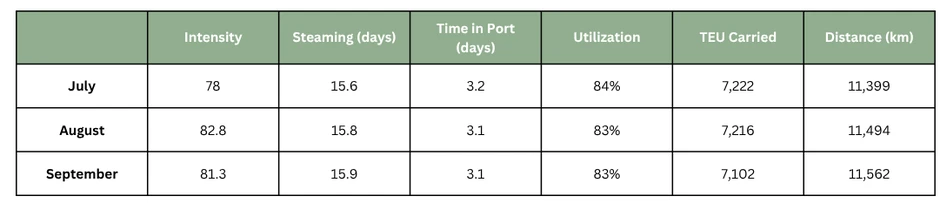
Table 3 Voyage characteristics on the China/East Asia to North America West Coast route per month, Q3 2025.
The table above illustrates voyage characteristics for this specific route per month. From one month to another, differences are not that important. However, it is essential to remember that most averages used in emissions reporting are derived from data that is one year old (at least).
On the same route during the third quarter of 2024, voyage characteristics were quite different. Indicatively, the average TEU carried in July 2024 was 8,142, while in July 2025, it was 7,222.
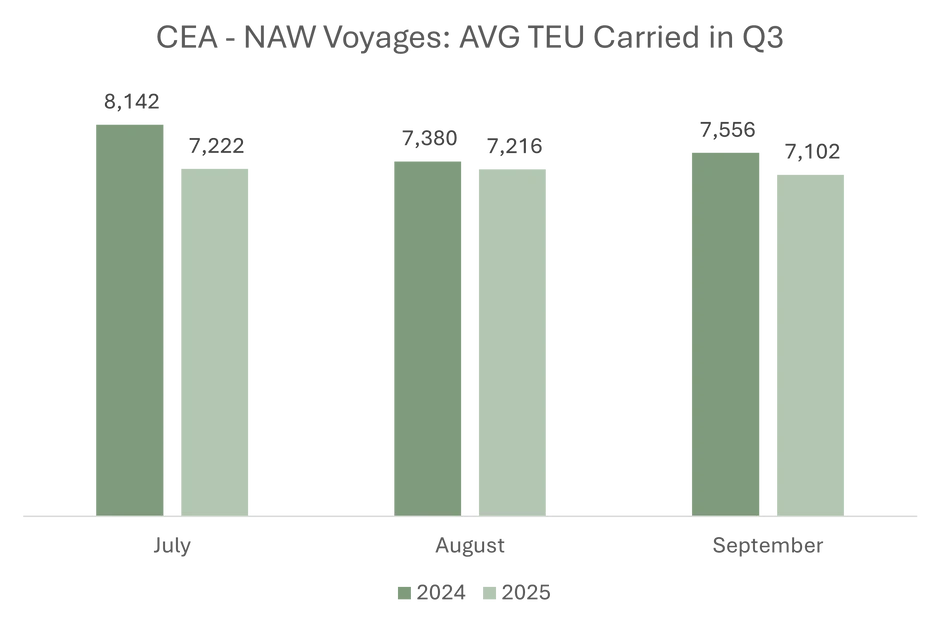
Figure 1 Average TEU Carried in the China/East Asia (CEA) to North America West Coast (NAW) route. Q3 2025
Even as the average time spent in port declined by 21% year-over-year and distances remained stable, a lower utilization rate led to lower transport work, resulting in a 9.7% annual increase in well-to-wake emissions intensity in July 2025. Therefore, accurate supply chain planning requires up-to-date primary data.
At the same time, to maximize efficiency benefits, supply chain executives cannot solely rely on route-specific averages. Even these average aggregate data from voyages whose characteristics may differ substantially.
Vessel Size Impact on Emissions Intensity
Notably, significant differences emerge between voyages on the same route when vessel size is taken into account. Average emissions on the China/East Asia to North America West Coast route were 5,030 tons in the third quarter of 2025. However, average emissions and transport work differ significantly between vessel sizes. Panamax containerships emitted on average 4,134 tons of CO2e and generated 44.1 million TEU km, while NeoPanamax containerships emitted 6,263 tons of CO2e and generated 142.4 million TEU km on average in each voyage.
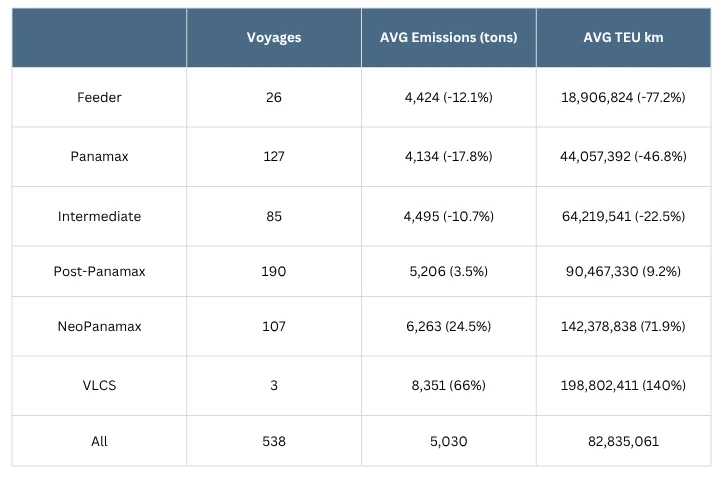
Table 4 Voyage characteristics on the China/East Asia to North America West Coast route per vessel size, Q3 2025.

Note 1: Percentages in parentheses denote change compared to all voyages in the China/East Asia to North America West Coast route

Note2: Feeder (Up to 2,999 TEU), Panamax (3,000-5,999 TEU), Intermediate (6,000 to 7,999 TEU), Post-Panamax (8,000-11,999 TEU), NeoPanamax (12,000 – 16,999 TEU), VLCS (At least 17,000 TEU).
As expected, smaller vessels such as Panamax and Intermediate containerships carried, on average, fewer TEU per voyage than the route-specific average. In contrast, the Post-Panamax and NeoPanamax containerships carried more TEU per voyage than the route-specific average.
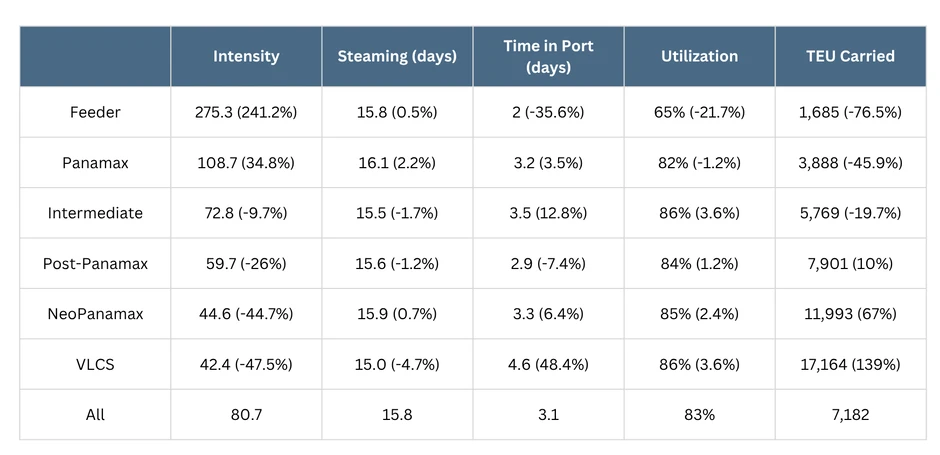
Table 5 Voyage characteristics on the China/East Asia to North America West Coast route per vessel size, Q3 2025.

Note 1: Percentages in parentheses denote change compared to all voyages in the China/East Asia to North America West Coast route

Note2: Feeder (Up to 2,999 TEU), Panamax (3,000-5,999 TEU), Intermediate (6,000 to 7,999 TEU), Post-Panamax (8,000-11,999 TEU), NeoPanamax (12,000 – 16,999 TEU), VLCS (At least 17,000 TEU).
Therefore, the emissions intensity differs significantly between Panamax and NeoPanamax containerships, primarily influenced by the average transport work each vessel category generates per voyage.
All this information is lost when aggregating data without differentiating between different vessel sizes. At the same time, crucial information would be lost if we aggregated all routes and only differentiated between vessel sizes. True accuracy depends on recent data that considers all crucial aspects that may affect a voyage’s efficiency, including voyage characteristics such as distance and vessel utilization, as well as vessel-specific traits like size and age.
Real Route Optimization: Shanghai to Los Angeles
This is precisely the data depth VesselBot offers through its platform. Through the “Voyage Optimizer” tool, we simulated cargo transport based on actual carriers’ schedules. In the specific trade, there were numerous services available. We chose two major ports: the Port of Shanghai as the port of departure and the Port of Los Angeles as the port of destination.
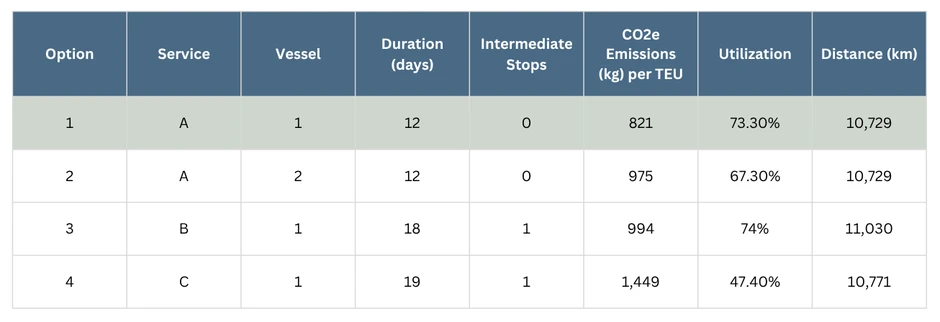
Table 6 Voyage characteristics between Shanghai and Los Angeles across different schedules. Source: VesselBot
Service A was offered with two different vessels, having the same duration, but slightly different utilization rates and quite different well-to-wake (WTW) emissions per TEU transported.
Service B had slightly worse environmental performance. Well-to-wake CO2e emissions reach 994 kg per TEU, while duration increases significantly. Even so, emissions are only marginally increased compared to the 2nd vessel offering service A, which is mainly due to the increased utilization levels service B offers.
Out of all options, Service C records the highest emissions, at 1,449 kg per TEU transported, while duration increases and utilization drops considerably.
A shipper would be better off choosing the first vessel that offers Service A to ship cargo from Shanghai to Los Angeles, as the benefits in emissions avoidance begin from 15.8% (154 fewer kg) and reach up to 43.3% (628 fewer kg) compared to other alternatives.
Today, carbon emissions future contracts trade at around $80 per ton. Therefore, the savings between different alternatives would range from $12.3/TEU to $50.2/TEU. While those savings may seem small at first glance, when a large company’s volume is taken into account, everything changes. Even at the most minor difference, which occurs when choosing the first vessel that offers service A, savings can be considerable.
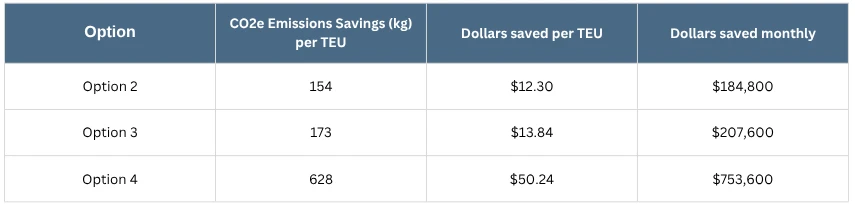
Table 7 Emission Savings between different schedules offering shipments between Shanghai and Los Angeles. Source: VesselBot
A shipper transporting 15,000 TEU every month between Shanghai and Los Angeles would save $12.3 per TEU or $184,800 per month.
Making Data-Driven Shipping Decisions
The data is clear. Industry averages mask critical variations that directly impact both emissions and costs. A shipper moving 15,000 TEU monthly between Shanghai and Los Angeles faces cost differences of up to $753,600 per month, depending on service and vessel selection, purely from carbon pricing considerations. These aren't marginal differences. They represent a substantial operational impact that compounds across every shipment.
Accurate supply chain efficiency requires systems built specifically for transportation carbon accounting. Generic methodologies cannot capture the dynamic interplay between vessel size, utilization, speed, and routing that determines actual emissions performance. VesselBot's Logistics Intelligence platform provides the primary, real-time data governance and validation that KPMG identified as critical, turning emissions reporting from a compliance exercise into a strategic tool for cost reduction and operational optimization.