
A tale of tariff threats through the lens of containership voyages and emissions
The U.S. and China are the two biggest economies in the world, influencing global trade and greatly impacting major geopolitical and economic events.
Despite their political frictions, they are intertwined from a trade perspective, as China imports large amounts of U.S. agricultural products, and the U.S. imports a considerable volume of containerized Chinese products. The U.S. remains the number one consumer market of final goods, while China remains the number one producer of such goods, which are often carried by sea, specifically on containerships.
As China continuously expands its footprint on core industries, the U.S. is trying to slow down that expansion. The current U.S. administration has chosen a confrontational path, threatening China with heavy tariffs on its products and implementing port fees for Chinese-owned, operated, or flagged vessels that call at U.S. ports.
The following analysis focuses on how the above-mentioned developments have affected containerized trade between the U.S. and China and supply chains. VesselBot has already shed some light on the “Trump” effect during its quarterly Decoding Maritime Emissions report (latest report available to download here).
Now we will dive into fronthaul (East to West) voyages between the two biggest economies, considering vessel size, age, shipbuilding country, and well-to-wake (WTW) intensity. The last segment of the blog will reveal the most vital ports for China-U.S. supply chains.
The differences between 2024 and 2025 underline the need for primary and up-to-date data regarding emissions. Relying on outdated data to make decisions today could prove detrimental to a company's sustainability strategy.
Trade Volatility in Focus: What the Data Tells Us
471 containership voyages [1] took place from China to the United States during the first half of 2025. Those levels represent a 0.4% increase compared to the first half of 2024; therefore, the number of voyages only changed slightly.
However, the number of voyages is the only metric that shows negligible changes. Speed dropped by 1.2% to 16.54 knots. Speed and fuel consumption do not have a linear relationship. Minimal changes to speed might have a significant effect on fuel consumption and, subsequently, vessel emissions. Drops in speed typically have a positive impact on vessel efficiency and well-to-wake (WTW) emissions intensity.
Vessel utilization dropped by 2.4%, highlighting that, on average, vessels were less loaded than in H1 2024. That development led to an average decrease of 7.4% in the number of TEU carried per voyage. Both these developments negatively impacted well-to-wake (WTW) emissions intensity.
The distance covered on each voyage decreased by 1.6% on average to 11,667 km, positively affecting the intensity. At the same time, the time spent in port increased to 4 days from 3.1, negatively affecting the emissions intensity.
Overall, while the average voyage emissions dropped 4.1% year-over-year to 5,244 tons in H1 2025, well-to-wake (WTW) emissions intensity increased by 17% to 88.64 g CO2 per TEU km.
Each month’s tale
In January 2025, total emissions were 469,886 tons, an increase of 23.3% compared to January 2024. That increase is heavily attributable to the sudden shock created by Trump’s tariff promises.
Emissions dropped 22.3% in February to 365,321 tons, yet remained 13.4% higher than in February 2024 (322,066 tons). In March, we observe that emissions are practically the same in 2024 and 2025. However, in both years, we observe a significant increase compared to February. In 2024, that increase was 31.7%, while in 2025, that increase was 16.1%.
Thereafter, in 2025, both April and May show drops in emissions from month to month (3.1% and 8.7% respectively). This appears to be another instance of the so-called 'Trump effect’, with retailers still carrying excess inventory from the Q1 import surge. Moreover, both in April and May, emissions were significantly lower year-over-year (12.3% and 20.6% respectively). While emissions dropped month-to-month in 2025, the opposite happened in 2024. In June 2025, emissions rebounded by 13%, but remained 14.5% lower than in June 2024.
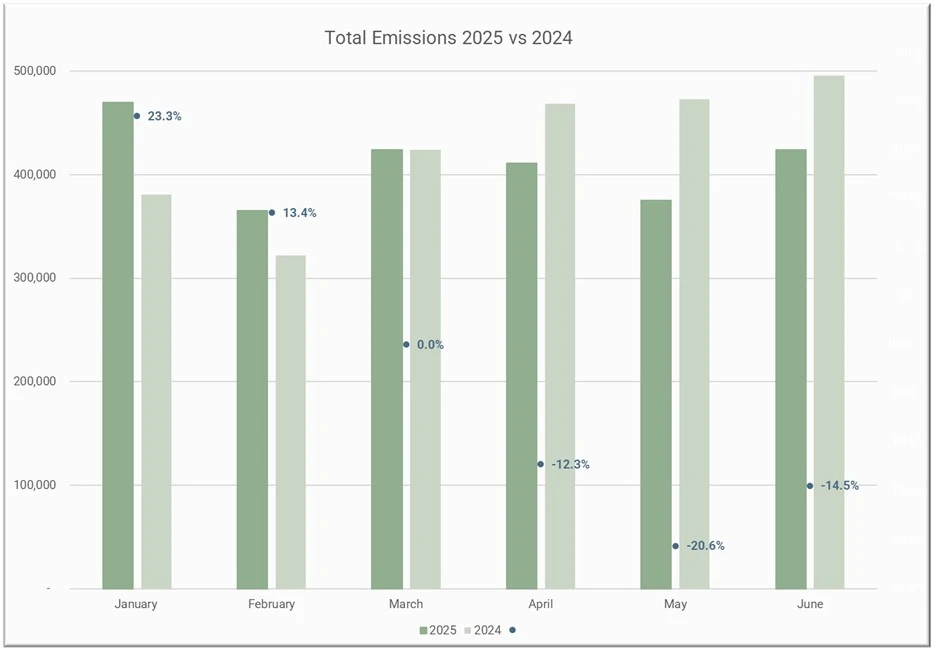
Figure 1: Distribution of emissions emitted during direct containership voyages from China to the U.S. H1 2024 & H1 2025 (Note: Percentages denote year-over-year changes)
A more thorough analysis of voyages' distinct characteristics will shed light on specifically why emissions increased and how different factors have affected the well-to-wake (WTW) intensity of voyages.
In January 2025, vessel utilization was 86% and the average TEU carried was 8,343. For both metrics, these levels are the highest recorded in the 12 months included in this analysis. Higher utilization levels and more TEU carried positively impact WTW intensity.
However, the distance covered increased by 4.7% year-over-year and was also 4.8% higher than the H1 average. Distance is a factor that negatively affects well-to-wake (WTW) intensity. As speed also increased by 1.6% to 16.4 knots, and the average time spent in ports [2] climbed to 5.2 days, the factors negatively impacting well-to-wake (WTW) intensity increased. Overall, intensity was 79.92, an increase of 21.7% year-over-year, but still 9.8% less than the H1 intensity average.
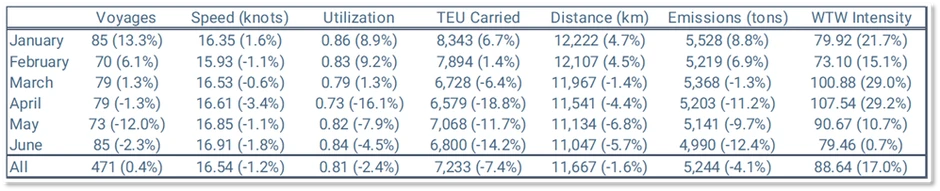
Table 1: China to U.S. direct voyage characteristics, H1 2025 (Note: percentages in parentheses denote year-over-year changes)
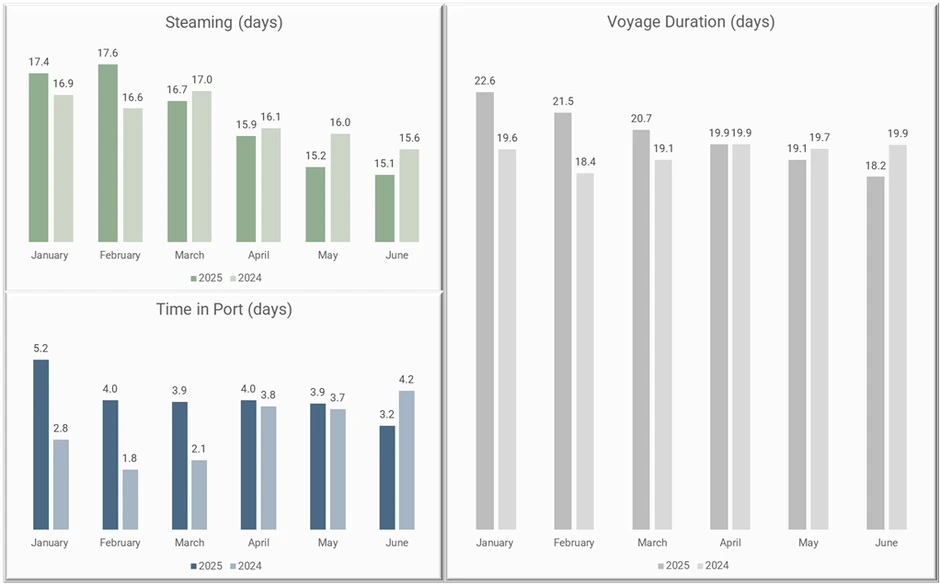
Figure 2: China to the U.S. direct voyage duration per month, H1 2025
In January 2025, 85 voyages took place (13.3% more compared to January 2024), while in February, 70 voyages took place (6.1% more compared to February 2024). As in January, February showed a high level of utilization (83% - 9.2% year-over-year increase) and a more minor increase in the number of TEU carried (1.4% to 7,894 TEU).
That effectively indicates that smaller vessels, more fully loaded, were deployed in the China–U.S. trade. While vessel speeds dropped by 1.1% to 15.93 knots, the average time spent in port remained high at 4 days, and WTW intensity was 73.1 in February (15.1% higher compared to February 2024 – 17.5% less than the H1 average).
The number of voyages increased in March to 79 (similar levels to 2024 when 78 voyages took place). Utilization was equal to 79% in March (similar levels year-to-year but slightly decreased from previous months), while the average TEU carried continued to drop, reaching 6,728 (6.4% fewer year-over-year and 12.7% fewer compared to February).
Vessel speed increased to 16.5 knots (0.6% year-over-year drop) in March, while the average distance covered decreased to 11,967 km (1.4% year-over-year drop). Overall, well-to-wake (WTW) intensity climbed to 100.88, an increase of 29% year-over-year and an increase of 13.8% compared to the H1 average.
March is a rather interesting month for China-U.S. maritime trade. While more voyages took place compared to February, vessels were less loaded, and in total fewer TEU were carried; 531,474 TEU were transported in March compared to 552,549 in February.
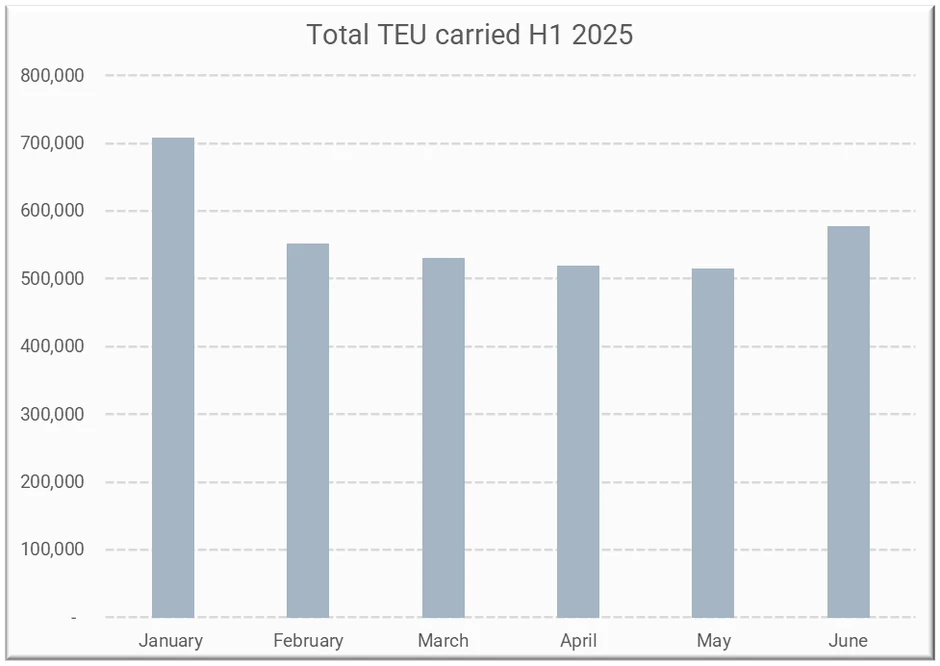
Figure 3: Total TEU transported in China to the U.S. direct voyages, H1 2025
April saw the same number of voyages as March, but utilization dropped to 73% (16.1% less year-over-year). Vessels carried on average 6,579 TEU, with the total TEU carried in voyages that started during April being 519,764, 2.2% fewer month-to-month. As time in port remained close to double levels year-over-year, the overall WTW intensity recorded a yearly increase of 29.2% at 107.5 g CO2 per TEU km. Those levels were the highest during H1 2025, 21.3% higher than the average for those six months.
In May, 73 voyages took place (12% fewer year-over-year and six fewer month-to-month). Utilization climbed to 82% (higher than both March and April but 7.9% less year-over-year), while the average TEU carried was 7,068 (higher than both March and April but 11.7% less year-over-year). The higher utilization in May offset the drop in voyages, since the total TEU carried only showed a 0.7% drop to 515,984 TEU from 519,764 in April.
At the same time, while much didn’t change from a trade perspective, a lot changed environmentally; even with a slight increase in vessel speed from 16.6 knots to 16.9 knots, intensity significantly decreased to 90.7 in May (from 107.5 in April and 10.7% less than May 2024).
June is another quite interesting month; 85 voyages took place (same as January), with a utilization of 84% (second highest after January: 86%). Speed remained at 16.9 knots, as in May, slightly increased from January (16.4 knots). The time spent in port per voyage averaged 3.2 days (instead of 4.2 days in June 2024). Overall, well-to-wake intensity was 79.5, almost equal to January at 79.9 g CO2e per TEU km.
However, the average TEU carried in June was 6,800 (14.2% less year-over-year and 18.5% less than January). In total, 577,981 TEU were transported in June, 12% more than in May but 18.5% fewer than in January. Moreover, the average distance covered by vessels was 11,047 km, compared to 12,222 km in January. Therefore, while January and June show similar vessel performances, their voyage characteristics differ significantly.
Is the China–Mexico–U.S. triangle still active?
During 2024, Mexico emerged as the winner of trade frictions between the world’s two superpowers. In an article published in September 2024, CNBC pointed out that Chinese exports to ports located on the West Coast of Mexico considerably increased, with analysts becoming suspicious regarding the country’s role as a loophole for the seamless continuation of China-U.S. trade.
On that note, we observe interesting patterns in 2025 as well. In March 2025, the number of TEUs directly transported from China to Mexico increased by 24.6% yearly and by 34.8% monthly. At the same time, the number of TEUs transported directly between China and the U.S. decreased by 5.2% year-over-year and 3.8% month-to-month. On the other hand, Mexico-U.S. trips showed more TEU carried on average, with an increase of 9.6% year-over-year and an increase of 19.5% month-to-month. Similar trends were also apparent in May and June, with Chinese exports to the U.S. decreasing while Mexican exports to the U.S. increasing.
However, that development does not necessarily prove a return of the China-Mexico-U.S. trade triangle. Fluctuations in TEU carried could also be explained by changes in liner services. Vessels could first have called at Mexican ports before arriving at U.S. ports.
To further dive into those differences, we also examine the non-direct trips between those countries. In H1 2025, 352 voyages started from China and later called at Mexico (without first calling at the U.S.), almost the same as in 2024 (353). At the same time, 352 trips were recorded between Mexico and the U.S. in H1 2024 (the same number as the China-Mexico trips), while in H1 2025, the number of voyages climbed to 547.
Another step could be to examine changes in the value of Chinese and Mexican products imported to the U.S. ports during 2025. However, direct comparisons are increasingly likely to compromise valid inference. Data provided by the United States government applies to all imports from Mexico. Mexico is the largest trade partner of the U.S., and a significant part of its imports are transported by land. At the same time, value fluctuations do not necessarily reflect volume fluctuations, due to the dynamic nature of prices.
With due consideration to the above, U.S. data show signs of inverse correlation between the value of U.S. imports of Chinese products and U.S. imports of Mexican products; in March and May, U.S. imports of Chinese goods dropped 7.1% and 19.2% month-to-month, while U.S. imports of Mexican goods increased by 15.2% and 10.7% month-to-month.
In general, the value of Chinese goods imported to the U.S. has been steadily declining throughout 2025, from 41.6 million dollars in January to 20.5 million dollars in May. That development is a clear sign of frictions between the two countries and the effect of those frictions on their bilateral trade. Given our data about voyages in June, we expect a rebound in the import value. As earlier reported, both the number of voyages and the total TEU carried between China and the U.S. increased month-to-month in June.
[1] We consider direct trips from China to the U.S. Any trip that may include the U.S. as the final destination but first calls at ports of other countries is not included in the analysis.
[2] Includes both anchorage and berthing